The graphs and numbers that explain the latest Covid-19 situation in France
Following a period of travel and family dinners during the Christmas holidays, is the Covid-19 virus spreading across France? Here's a look at the latest key numbers.
As the UK has announced a third, nationwide lockdown following an explosion in Covid-19 cases, France has reopened schools and loosened rules on remote working slightly, allowing for employees currently working from home to go back into office one day a week if they want.
Yesterday French epidemiologist Pascal Crépey told The Local that France could, for the moment, afford to reopen schools.
So what do the numbers say? Here's a look at the latest data, put in context by key developments and trends in order to give a thorough look at what the coronavirus situation is like in France today.
Overview
The graphs below in the tweet by AFP show the big picture, with new cases, hospital admissions, intensive care admissions and hospital deaths as of January 4th.
Évolution en France du nombre de nouveaux cas de Covid-19, des hospitalisations, des entrées en réanimation et des décès #AFP pic.twitter.com/fQAdDgmIEZ
— Agence France-Presse (@afpfr) January 5, 2021
All indicators apart from the number of new cases have dropped slightly over the last couple of weeks, with hospital admissions, intensive care admissions and deaths decreasing by 2, 1 and 4 percent respectively.
However the drop is small and the number of new cases has risen by 16 percent, which could indicate an early beginning of a new resurgence in viral spread.
Increased testing before the Christmas holidays could account for some of the rise in case numbers - three million tests were performed in the week before Christmas as many people opted to get a test before travelling to see loved ones.
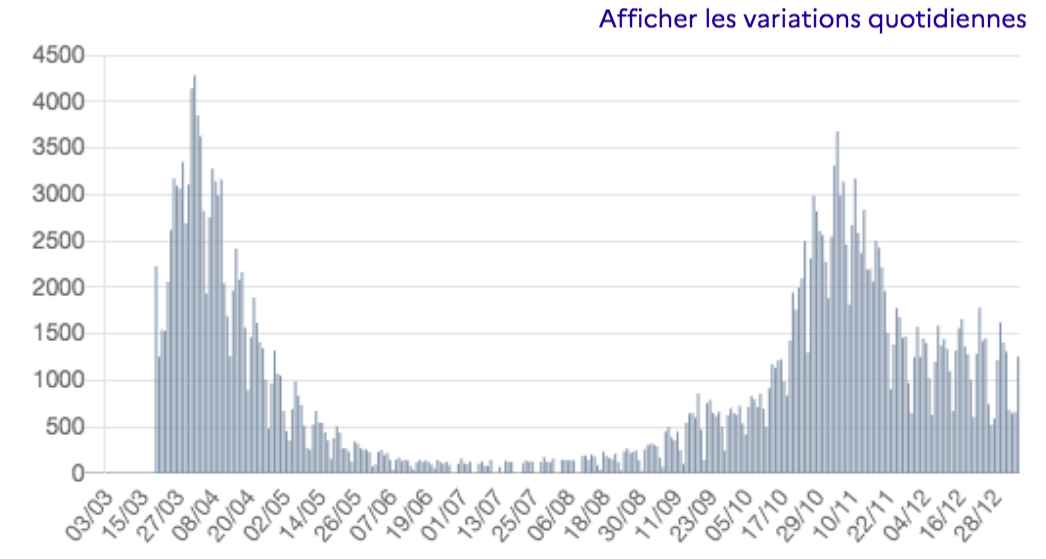
Cases
4,022 - the number of new Covid-19 cases recorded in the last 24 hours on January 4th. This number must be interpreted with caution as it usually drops over the weekend and in the early days of the week, so a weekly average of cases is a better indicator of the actual situation on the ground (see below).
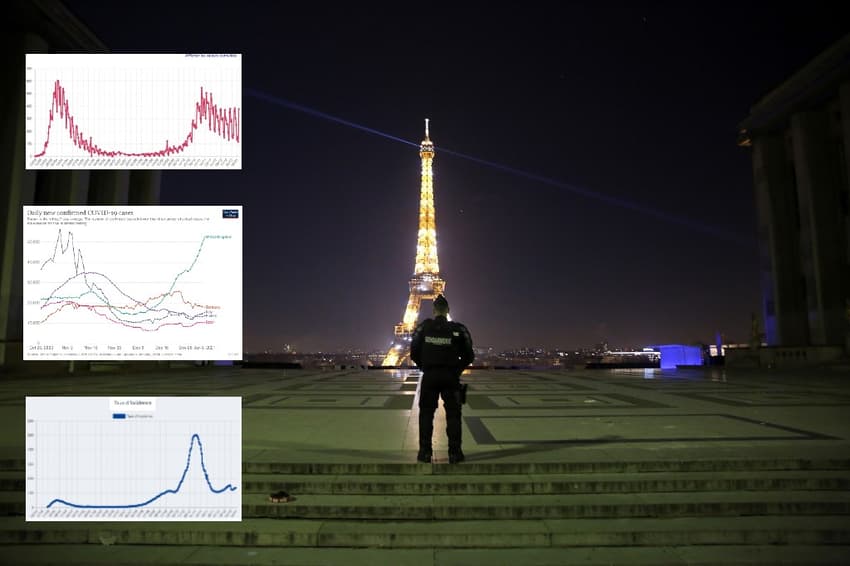
France has seen a slight increase in the number of daily cases in the weeks since lockdown was listed on December 15th, but there has so far not been an explosion of cases as seen during the second wave of the virus in October and November.
The graph below illustrates how the number of new Covid-19 cases has developed in France since the early days of the pandemic in March. The non-existing spike in spring is not due to a lack of cases, but rather because testing was very limited back then.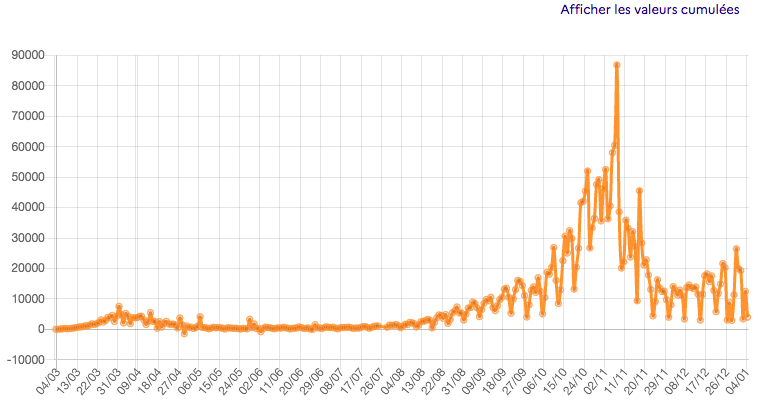 Source: French government
13,087 - the weekly average of new cases as of January 4th, up 8 percent from the preceding week, according to French data scientist Guillaume Rozier, who keeps track of the virus in France on his Twitter account CovidTracker.
Source: French government
13,087 - the weekly average of new cases as of January 4th, up 8 percent from the preceding week, according to French data scientist Guillaume Rozier, who keeps track of the virus in France on his Twitter account CovidTracker.
Après On détecte en ce moment 13 087 cas chaque jour en moyenne. C’est 8% de plus que la semaine dernière (qui incluait le 25, mais cette semaine on a le 1er). pic.twitter.com/S6pRLEYAHv
— GRZ - CovidTracker (@GuillaumeRozier) January 4, 2021
The current level of weekly cases is nearly three times higher than the goal of 5,000 cases per day that the government hoped to reach before easing lockdown, which also was set as the threshold for reopening bars and restaurants on January 20th.
It has, however, stayed roughly consistent at this level since the beginning of December.
The government has decided, due to the too high number of cases, not to reopen cultural establishments as planned on January 7th and also postpone the date for reopening bars and restaurants. The prime minister is expected to give more details on the future steps in a press conference on Thursday.
International comparisons
The graph below shows how France is doing compared to other countries, with the UK seeing a unique explosion in cases compared to its European peers. The graph is a based on a seven-day average of the number of new Covid-19 cases registered in each country.
The French cases show a big spike in late October, followed by a sharp drop after lockdown was imposed on October 30th and then a plateau from the beginning of December.
Source: Our World in Data
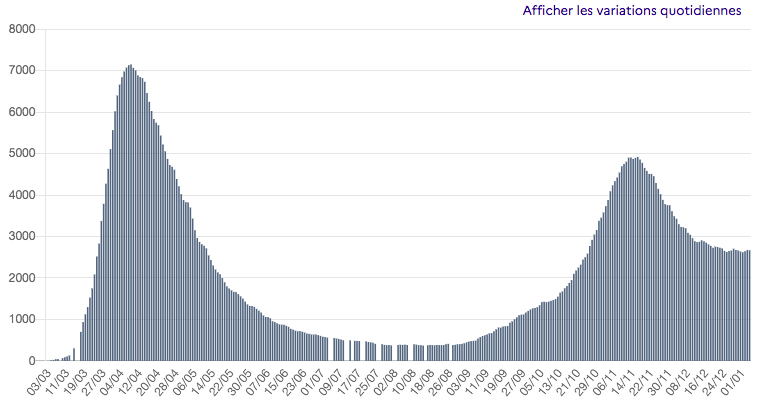
Hospitals
24,995 - the total number of Covid-19 hospital patients on January 4th (full data on the French government's website, click here).
As the graph below shows, the number of patients hospitalised for Covid-19 in France has been quite stable since December 9th. On that date France counted 25,558 Covid-19 patients, on December 16th the number had fallen to 25,315, on December 23rd it was 24,884, on December 30th it had dropped to 24,593.
Source: French government
At the peak of the second wave of the virus, in mid November, France counted over 30,000 Covid-19 hospital patients, just as it did at the peak of the first wave in mid April. On November 16th the number was 33,497 compared to 32,292 on April 14th.
1,258 - The number of new hospital admissions on January 4th, which was 602 more than the number on January 3rd, although that was a Sunday and there is usually a post-weekend spike in these numbers early in the week.
The hospital admissions rate has been relatively stable over the past weeks (as shown in the graph below), with numbers fluctuating between 1,776 (December 22nd) and 513 (December 26th) between November 22nd, when the rate stabilised after the peak, and now.
Source: French government
2,666 - the total number of patients receiving intensive care treatment per January 4th.
The graph below illustrates how intensive care numbers have plateaued since the end of the peak of the second wave in mid November, dropping down from 4,919 on November 16th to 2,861 on December 12th, and then slowly dropping slightly most days until the current level of 2,666 patients.
Source: French government
The number of intensive care patients is key to predict future deaths. If intensive case numbers spike, it means the government will quickly have to consider a toughening of health rules in order to avoid hospitals getting overwhelmed with patients.
However, France has improved its medical treatment of Covid-19 patients since this spring, which means fewer patients in total end up in intensive case units.
This was a core reason why hospitals did not see an equal spike in intensive care patient admissions this autumn - even though the total number of patients in hospital for Covid-19 was slightly higher than in spring.
READ ALSO: Why France's second wave of Covid-19 is very different to the first
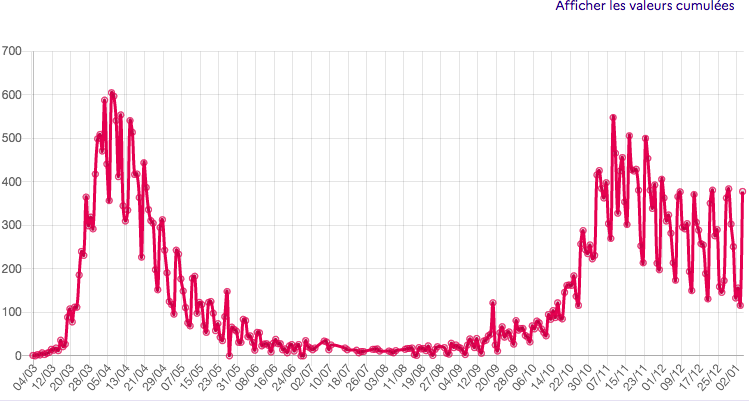
Deaths
378 - the number of deaths in hospitals caused by Covid-19 in the last 24 hours on Monday, January 4th. This number should be carefully interpreted due to weekend lags in hospitals reporting deaths. Usually the death toll drops over the weekend and spikes later in the week. Last Monday, on December 28th, the death toll in hospitals was 364, and the Monday before that it was 354.
The current death toll has been relatively stable for weeks now. It peaked at 551 on November 9th, and then slowly decreased as the second lockdown - in effect as of October 30th - halted the spread of the virus. Health experts have warned it may increase again following the Christmas period, when families across France got together for the holiday season in a rare period of socialisation that followed weeks of lockdown.
The graph below shows how the daily death toll has fluctuated since the early days of the pandemic in early March. For an interactive version of this and the other graphs included in this story, click here.
Source: French government
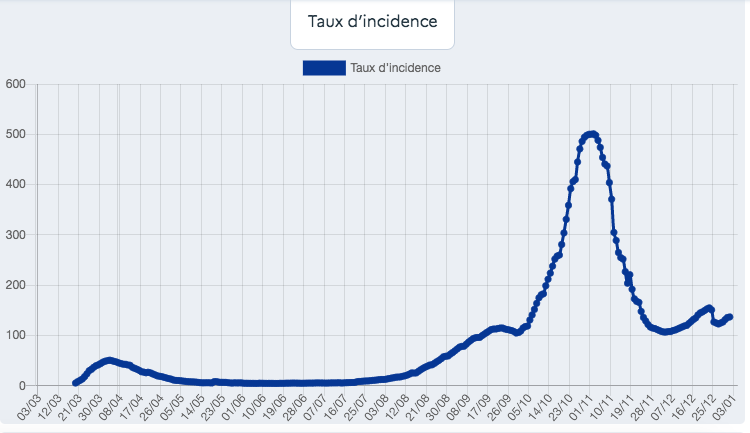
Incidence rate
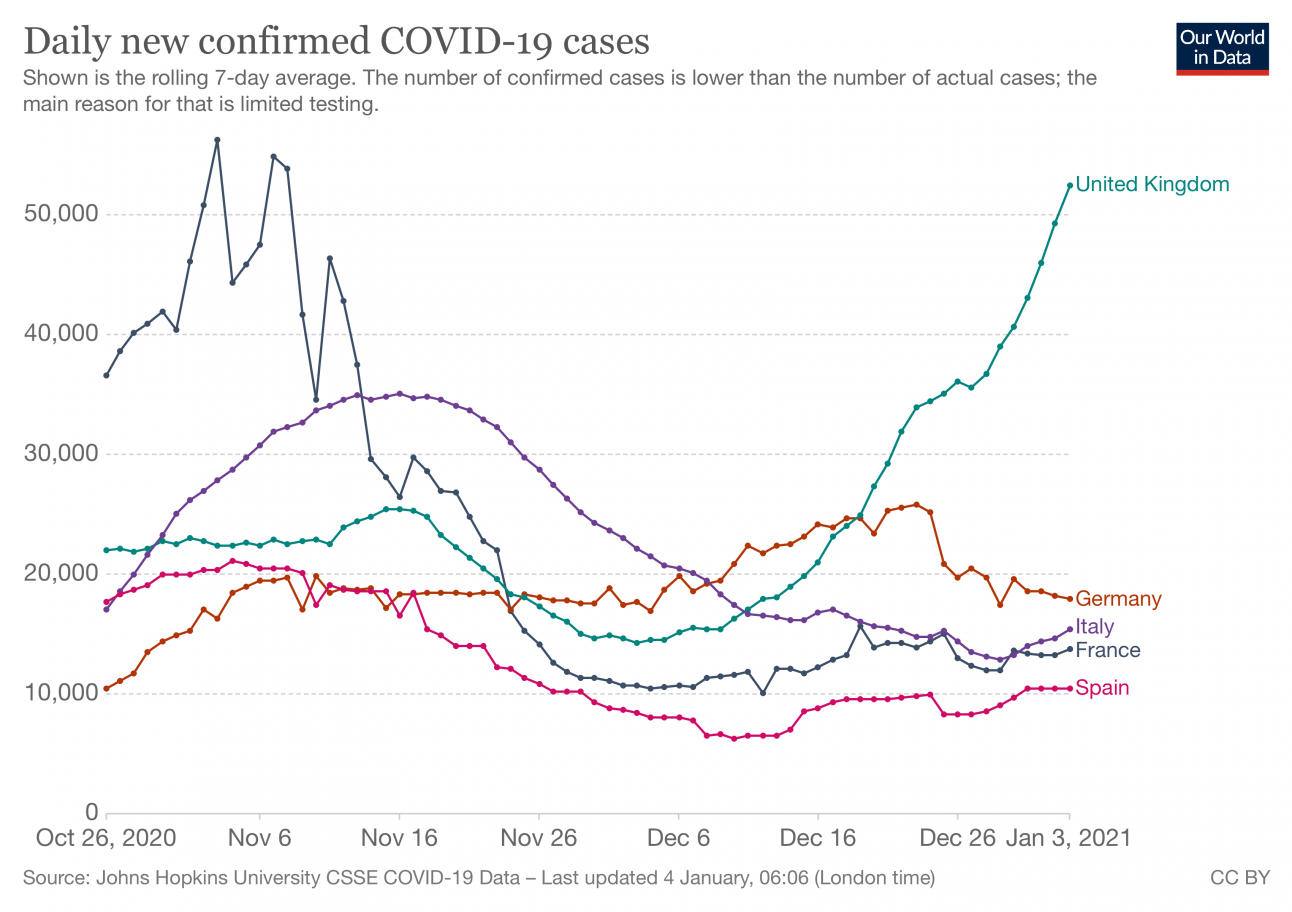
137 - the incidence rate as of January 1st. The incidence rate refers to the number of new positive tests per 100,000 inhabitants on average in the preceding seven days.
The graph below shows how the incidence rate has developed since March, with a huge spike during the second wave of the pandemic. Again, the non-existing spike in spring is not due to a lack of cases, but rather because of a lack of testing.
 Source: French government
5.2% - The test positivity rate per January 1st. This rate, which says how big of a proportion of the total tests come back positive, has risen in the past week, from a low point on December 25th of 2.76 percent to the current level, although the rates recorded during the holiday season must be interpreted with caution as some labs were closed or operated on reduced hours.
The graph below shows how the rate has developed since France rolled out increased testing this autumn. It peaked at 15.9 percent on October 28th, and then dropped rapidly as the nighttime curfew installed in several areas was replaced by the nationwide lockdown on October 30th.
Source: French government
5.2% - The test positivity rate per January 1st. This rate, which says how big of a proportion of the total tests come back positive, has risen in the past week, from a low point on December 25th of 2.76 percent to the current level, although the rates recorded during the holiday season must be interpreted with caution as some labs were closed or operated on reduced hours.
The graph below shows how the rate has developed since France rolled out increased testing this autumn. It peaked at 15.9 percent on October 28th, and then dropped rapidly as the nighttime curfew installed in several areas was replaced by the nationwide lockdown on October 30th.
 Source: French government
Regional variations
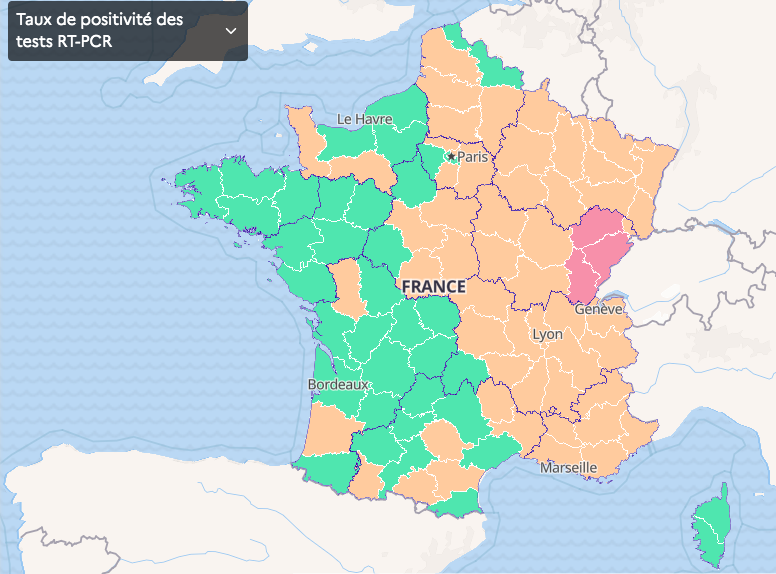
The map below shows how Covid-19 has France pretty much split in two. It must be interpreted with some caution as it accounts for not only test positivity rates as shown in the top corner, but also other indicators such as pressure on intensive are units and incidence rates.
Source: French government
Regional variations
The map below shows how Covid-19 has France pretty much split in two. It must be interpreted with some caution as it accounts for not only test positivity rates as shown in the top corner, but also other indicators such as pressure on intensive are units and incidence rates.
 Source: French government
The map below, collected from Santé Publique France, shows an interactive version of this map with detailed information on a local level.
Health authorities have said they are concerned about the situation in four areas of eastern France - the regions of Grand Est, Bourgogne-Franche-Comté and Auvergne-Rhône-Alpes and the départements of Alpes-Maritime, which contains the city of Nice.
An earlier curfew of 6pm has been imposed in 15 déprtements, all in eastern France, in an attempt to curb case numbers.
Christmas spike?
So is there evidence of a spike in cases caused by people travelling and socialising over the holidays?
Authorities were very worried about a repeat of the 'Thanksgiving effect' seen in the USA, where cases shot up after the holidays. People in France were allowed to travel and see friends and family over the Christmas and New Year holidays, and many did. The 8pm curfew remained in place every day apart from December 24th and people were advised to limit gatherings to six people, and self-isolate for eight days prior to travel if they were visiting vulnerable people.
So far, there doesn't seem to be any evidence of a spike, but it may be too early to tell. Schools in France returned on Monday, January 4th, and most people also returned to work on that date.
Health Minister Olivier Véran said they would expect to see evidence of the start of a spike by 'early January'.
A main lesson drawn from the previous waves of infections is that, when the rates begin to rise, they do so very quickly.
Source: French government
The map below, collected from Santé Publique France, shows an interactive version of this map with detailed information on a local level.
Health authorities have said they are concerned about the situation in four areas of eastern France - the regions of Grand Est, Bourgogne-Franche-Comté and Auvergne-Rhône-Alpes and the départements of Alpes-Maritime, which contains the city of Nice.
An earlier curfew of 6pm has been imposed in 15 déprtements, all in eastern France, in an attempt to curb case numbers.
Christmas spike?
So is there evidence of a spike in cases caused by people travelling and socialising over the holidays?
Authorities were very worried about a repeat of the 'Thanksgiving effect' seen in the USA, where cases shot up after the holidays. People in France were allowed to travel and see friends and family over the Christmas and New Year holidays, and many did. The 8pm curfew remained in place every day apart from December 24th and people were advised to limit gatherings to six people, and self-isolate for eight days prior to travel if they were visiting vulnerable people.
So far, there doesn't seem to be any evidence of a spike, but it may be too early to tell. Schools in France returned on Monday, January 4th, and most people also returned to work on that date.
Health Minister Olivier Véran said they would expect to see evidence of the start of a spike by 'early January'.
A main lesson drawn from the previous waves of infections is that, when the rates begin to rise, they do so very quickly.
Comments
See Also
As the UK has announced a third, nationwide lockdown following an explosion in Covid-19 cases, France has reopened schools and loosened rules on remote working slightly, allowing for employees currently working from home to go back into office one day a week if they want.
Évolution en France du nombre de nouveaux cas de Covid-19, des hospitalisations, des entrées en réanimation et des décès #AFP pic.twitter.com/fQAdDgmIEZ
— Agence France-Presse (@afpfr) January 5, 2021
Après On détecte en ce moment 13 087 cas chaque jour en moyenne. C’est 8% de plus que la semaine dernière (qui incluait le 25, mais cette semaine on a le 1er). pic.twitter.com/S6pRLEYAHv
— GRZ - CovidTracker (@GuillaumeRozier) January 4, 2021
Source: Our World in Data
Hospitals
24,995 - the total number of Covid-19 hospital patients on January 4th (full data on the French government's website, click here).
As the graph below shows, the number of patients hospitalised for Covid-19 in France has been quite stable since December 9th. On that date France counted 25,558 Covid-19 patients, on December 16th the number had fallen to 25,315, on December 23rd it was 24,884, on December 30th it had dropped to 24,593.
Source: French government
At the peak of the second wave of the virus, in mid November, France counted over 30,000 Covid-19 hospital patients, just as it did at the peak of the first wave in mid April. On November 16th the number was 33,497 compared to 32,292 on April 14th.
1,258 - The number of new hospital admissions on January 4th, which was 602 more than the number on January 3rd, although that was a Sunday and there is usually a post-weekend spike in these numbers early in the week.
The hospital admissions rate has been relatively stable over the past weeks (as shown in the graph below), with numbers fluctuating between 1,776 (December 22nd) and 513 (December 26th) between November 22nd, when the rate stabilised after the peak, and now.
Source: French government
2,666 - the total number of patients receiving intensive care treatment per January 4th.
The graph below illustrates how intensive care numbers have plateaued since the end of the peak of the second wave in mid November, dropping down from 4,919 on November 16th to 2,861 on December 12th, and then slowly dropping slightly most days until the current level of 2,666 patients.
Source: French government
The number of intensive care patients is key to predict future deaths. If intensive case numbers spike, it means the government will quickly have to consider a toughening of health rules in order to avoid hospitals getting overwhelmed with patients.
However, France has improved its medical treatment of Covid-19 patients since this spring, which means fewer patients in total end up in intensive case units.
This was a core reason why hospitals did not see an equal spike in intensive care patient admissions this autumn - even though the total number of patients in hospital for Covid-19 was slightly higher than in spring.
READ ALSO: Why France's second wave of Covid-19 is very different to the first
Deaths
378 - the number of deaths in hospitals caused by Covid-19 in the last 24 hours on Monday, January 4th. This number should be carefully interpreted due to weekend lags in hospitals reporting deaths. Usually the death toll drops over the weekend and spikes later in the week. Last Monday, on December 28th, the death toll in hospitals was 364, and the Monday before that it was 354.
The current death toll has been relatively stable for weeks now. It peaked at 551 on November 9th, and then slowly decreased as the second lockdown - in effect as of October 30th - halted the spread of the virus. Health experts have warned it may increase again following the Christmas period, when families across France got together for the holiday season in a rare period of socialisation that followed weeks of lockdown.
The graph below shows how the daily death toll has fluctuated since the early days of the pandemic in early March. For an interactive version of this and the other graphs included in this story, click here.
Source: French government
Join the conversation in our comments section below. Share your own views and experience and if you have a question or suggestion for our journalists then email us at [email protected].
Please keep comments civil, constructive and on topic – and make sure to read our terms of use before getting involved.
Please log in here to leave a comment.