MAP: Where in France are Covid-19 infections rising as lockdown ends?

As France replaces its lockdown with a nighttime curfew, the Covid-19 health situation is varied across regions, with some seeing higher levels of spread than others.
As France eased its nationwide lockdown on December 15th, its national incidence rate - the number of Covid cases per 100,000 inhabitants over the previous seven days - stood at 116.
This was down from over 500 in the early days of the second nationwide lockdown, on November 2nd, when the nationwide incidence rate peaked at 500 per 100,000.
It also compares favourably with France's neighbours, data from December 10th showed 150 cases per 100,000 in Germany, 250 per 100,000 in Italy and 300 per 100,000 in Switzerland.
But since the beginning of the pandemic there have been significant regional differences in the level of Covid-19 spread across France.
The incidence rate is one of the main indicators French health authorities use to monitor the Covid-19 epidemic in the country.
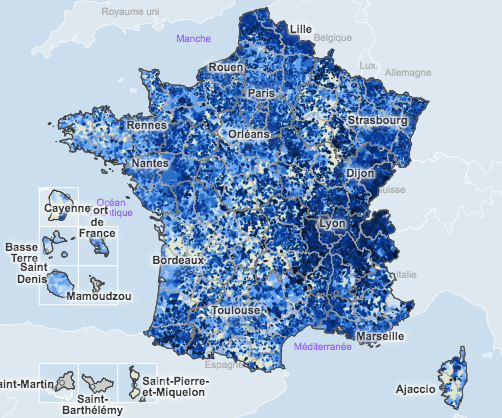
The map below shows how it varied across the French mainland according to the most recent data, published by France's public health agency Santé Publique France for the week of December 5th until December 11th.
Source: Santé Publique France
What do the colours on the map mean?
Communes coloured the lighter shades of blue on the map reported a low incidence rate between 10 and 50 per 100,000 inhabitants - a colour that until recently did not exist on the map, but which now has replaced much of the darker blue zones.
As the key for the map above shows, the mid blue tones in the middle on the key refers to an incidence rate between 150 and 250 per 100,000, while the darker shade of blue reflects a rate between 250 and 1,000. The highest level of spread is the blackish dark blue, referring to a spread above 1,000 per 100,000 inhabitants.
Which areas have high levels of spread?
While the areas with extremely high levels of spread have shrunk down to the size of pinheads on the map, there are still regions with local concentrations of spread above 1,000 new cases per 100,000 inhabitants.
In Bourgogne in eastern France, several communes reported levels of spread above 1,000 - Noyers, Sarry, Môlay and a few others in the same area were among them.
The same was the case for several communes on the Belgian border further northeast, on the Swiss border further south, and on the Italian border even further south.
The Alpes-Maritimes département bordering Italy reported a relatively high infection rate in some communes - 1,000 in Clans, Rimplass, Saint-Sauveur-sur-Tinée and Fontan, and between 500 and 1,000 in three others.
On the western side of France, some areas in Normandy too reported high levels of Covid-19 spread. Some communes in the area between Rennes and Orléans had incidence rates that approached 1,000 per 100,000 inhabitants.
Southwest, in the Aquitaine region and on the western part of the Midi-Pyrénées region, some communes also saw high levels of spread.
Which areas have low levels of spread?
Interestingly, Paris and other big cities reported relatively lower levels of spread than some of the less densely populated départements.
The greater Paris region Île-de-France was shaded lighter versions of blue, signifying levels of spread between 10 and 50, with some areas reporting higher levels albeit much lower than the sky-high rates from early November.
Similarly Lyon and its surrounding area had seen case rates plunge down from over 1,000 just a few weeks back to roughly 250 according to the latest data.
This could reflect the fact that the bigger cities had a curfew in place before the country locked down on October 30th.
What was the situation before?
Just one month back, on November 15th, the map (see map below) looked very different from now. Back then most areas reported high levels of spread with an incidence rate levelling between 150 and 500, and several communes had spread levels above 1,000 per 100,000 inhabitants.
 Source: Santé Publique France
Especially hard-hit areas such as Lyon had levels of spread over 1,000 per 100,000 inhabitants, and the same was the case for several communes on the southwestern tip of the country.
Areas around the cities Dijon, Strasbourg, Paris and Rouen also reported high levels of spread, numbers that seemingly has plunged in the weeks that followed.
But overall the situation is pretty good?
Not quite. Even if the general level of Covid-19 spread in France has decreased dramatically compared to what it was when the government imposed lockdown back on October 30th, the government has stressed that the virus is still circulating at a worryingly high level.
There is a real danger of an epidemic resurgence following the easing of lockdown on December 15th and the ensuing Christmas celebrations and family gatherings.
Epidemiologists have warned that the when Covid-19 cases begin to spike, they do so quickly. Before the second lockdown, the number of cases exploded in just one month.
This is why the government has asked everyone to be careful, follow general health advice and also limit socialising as much as possible even as the rules are relaxed.
Announcing the new rules, Prime Minister Jean Castex pointed to the surge in cases in the USA which followed Thanksgiving as a example that France wished to avoid.
Above all, they want to prevent hospital patient numbers from spiking again, which would strain already exhausted hospital staff even more and potentially causing supplementary delays in non-Covid medical treatments, with grave consequences for the patients concerned.
What is the situation in hospitals?
Source: Santé Publique France
Especially hard-hit areas such as Lyon had levels of spread over 1,000 per 100,000 inhabitants, and the same was the case for several communes on the southwestern tip of the country.
Areas around the cities Dijon, Strasbourg, Paris and Rouen also reported high levels of spread, numbers that seemingly has plunged in the weeks that followed.
But overall the situation is pretty good?
Not quite. Even if the general level of Covid-19 spread in France has decreased dramatically compared to what it was when the government imposed lockdown back on October 30th, the government has stressed that the virus is still circulating at a worryingly high level.
There is a real danger of an epidemic resurgence following the easing of lockdown on December 15th and the ensuing Christmas celebrations and family gatherings.
Epidemiologists have warned that the when Covid-19 cases begin to spike, they do so quickly. Before the second lockdown, the number of cases exploded in just one month.
This is why the government has asked everyone to be careful, follow general health advice and also limit socialising as much as possible even as the rules are relaxed.
Announcing the new rules, Prime Minister Jean Castex pointed to the surge in cases in the USA which followed Thanksgiving as a example that France wished to avoid.
Above all, they want to prevent hospital patient numbers from spiking again, which would strain already exhausted hospital staff even more and potentially causing supplementary delays in non-Covid medical treatments, with grave consequences for the patients concerned.
What is the situation in hospitals?
Other crucial indicators to monitor the spread of the virus are hospital patient numbers and intensive care patient numbers.
On December 14th, French hospitals counted 25,481 Covid-19 patients, a drop down from over 30,000 at the beginning of the second lockdown
However there were big regional differences in the level of pressure on hospitals. The map below shows how many patients were currently hospitalised in different French regions on December 14th.
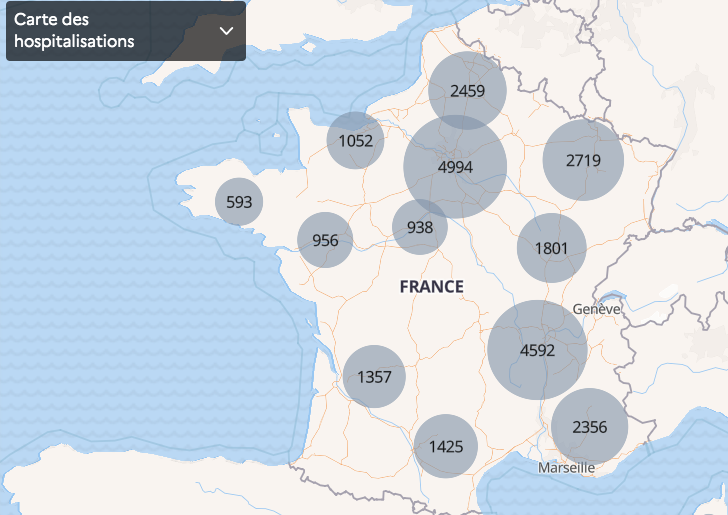
Photo: French government
The same was the case for intensive care wards, which counted 2,906 total patients in France on December 14th. This number has decreased too in recent weeks and has now dropped below the set goal of less than 3,000 intensive care patients in total nationwide.
The map below shows how many patients were admitted to hospital intensive care wards in different French regions per December 14th.
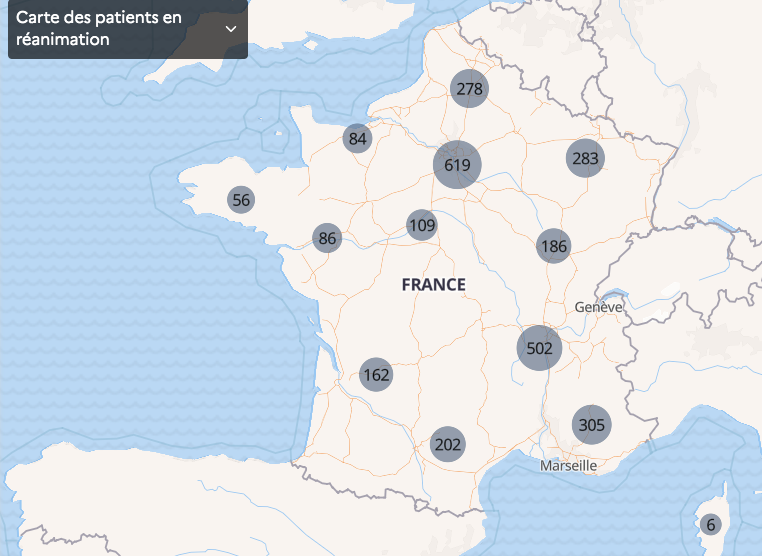
Photo: French government
Comments
See Also
As France eased its nationwide lockdown on December 15th, its national incidence rate - the number of Covid cases per 100,000 inhabitants over the previous seven days - stood at 116.
This was down from over 500 in the early days of the second nationwide lockdown, on November 2nd, when the nationwide incidence rate peaked at 500 per 100,000.
It also compares favourably with France's neighbours, data from December 10th showed 150 cases per 100,000 in Germany, 250 per 100,000 in Italy and 300 per 100,000 in Switzerland.
But since the beginning of the pandemic there have been significant regional differences in the level of Covid-19 spread across France.
The incidence rate is one of the main indicators French health authorities use to monitor the Covid-19 epidemic in the country.
The map below shows how it varied across the French mainland according to the most recent data, published by France's public health agency Santé Publique France for the week of December 5th until December 11th.
Source: Santé Publique France
What do the colours on the map mean?
Communes coloured the lighter shades of blue on the map reported a low incidence rate between 10 and 50 per 100,000 inhabitants - a colour that until recently did not exist on the map, but which now has replaced much of the darker blue zones.
The Alpes-Maritimes département bordering Italy reported a relatively high infection rate in some communes - 1,000 in Clans, Rimplass, Saint-Sauveur-sur-Tinée and Fontan, and between 500 and 1,000 in three others.
On the western side of France, some areas in Normandy too reported high levels of Covid-19 spread. Some communes in the area between Rennes and Orléans had incidence rates that approached 1,000 per 100,000 inhabitants.
Other crucial indicators to monitor the spread of the virus are hospital patient numbers and intensive care patient numbers.
On December 14th, French hospitals counted 25,481 Covid-19 patients, a drop down from over 30,000 at the beginning of the second lockdown
However there were big regional differences in the level of pressure on hospitals. The map below shows how many patients were currently hospitalised in different French regions on December 14th.
Photo: French government
The same was the case for intensive care wards, which counted 2,906 total patients in France on December 14th. This number has decreased too in recent weeks and has now dropped below the set goal of less than 3,000 intensive care patients in total nationwide.
The map below shows how many patients were admitted to hospital intensive care wards in different French regions per December 14th.
Photo: French government
Join the conversation in our comments section below. Share your own views and experience and if you have a question or suggestion for our journalists then email us at [email protected].
Please keep comments civil, constructive and on topic – and make sure to read our terms of use before getting involved.
Please log in here to leave a comment.