MAP: The départements in France with the highest death rates during the coronavirus outbreak

France has been hit hard by coronavirus, with more than 26,000 deaths directly attributed to the virus so far, but many of the deaths have been concentrated in certain areas.
French national statistics body INSEE has released new data showing the excess death rate in France by département during the outbreak.
The excess death rate measures all deaths, not just those attributed to coronavirus, and compares them to deaths in the same period in preceding years.
Due to variations in the way different countries count their coronavirus cases and deaths, this is seen is one of the most reliable ways of making international comparisons.
The latest tranche of French data covers March 1st to April 20th and compares it to the same period in 2019. The numbers show how many more deaths each département recorded, compared to last year.
Départements marked 0 on the map have either the same number or fewer deaths than the same period in 2019.
READ ALSO Three reasons why Paris' northern suburbs have such a high death rate
Not all deaths are coronavirus related of course and in many places deaths have actually fallen due to factors such as a lack of road accidents or workplace accidents as people were largely confined to their homes.
!function(){"use strict";window.addEventListener("message",(function(a){if(void 0!==a.data["datawrapper-height"])for(var e in a.data["datawrapper-height"]){var t=document.getElementById("datawrapper-chart-"+e)||document.querySelector("iframe[src*='"+e+"']");t&&(t.style.height=a.data["datawrapper-height"][e]+"px")}}))}();
The deaths are largely confined to the eastern France and the greater Paris region.
In percentage terms, the départements with the highest rate of excess deaths are Haut-Rhin in eastern France (135 percent more than 2019) and five départements in the Paris region; Seine-Saint-Denis (+ 130 percent), Hauts-de-Seine (+ 122 percent), Val-de-Marne (+ 104 percent), Essonne and Val-d’Oise (+ 99 percent each).
As France begins lifting its lockdown the country has been divided into red zones and green zones, with slightly looser restrictions in the green zones, which have low rates of coronavirus infection and hospital occupancy.
READ ALSO What does it mean if you live in a red département?
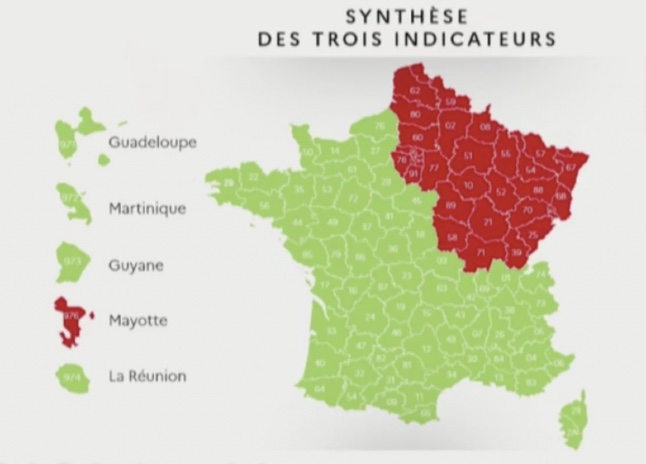
The red zones. Map: Santé Publique France
Four regions are in red - Île-de-France, Grand-Est, Hauts-de-France and Bourgogne-Franche-Comté - and one département, the overseas territory of Mayotte.
In total between March 1st and April 20th, France recorded 23,225 more deaths than the same period in 2019.
The country's official coronavirus death toll to May 12th is 26,991.
The French official figures include deaths in hospitals and in care homes while countries such as Italy and Spain only count hospital deaths. The UK, while initially counting only hospital deaths, now includes care home deaths in its statistics.
READ ALSO OPINION How can we compare France's coronavirus death toll when countries play by different rules?
The French figures do not include deaths at home, although public health bodies say these will be added from June, but the similarity between the excess deaths and the official figures suggest that the French official death toll is reasonably complete.
Comments (1)
See Also
French national statistics body INSEE has released new data showing the excess death rate in France by département during the outbreak.
The excess death rate measures all deaths, not just those attributed to coronavirus, and compares them to deaths in the same period in preceding years.
Due to variations in the way different countries count their coronavirus cases and deaths, this is seen is one of the most reliable ways of making international comparisons.
The latest tranche of French data covers March 1st to April 20th and compares it to the same period in 2019. The numbers show how many more deaths each département recorded, compared to last year.
Départements marked 0 on the map have either the same number or fewer deaths than the same period in 2019.
READ ALSO Three reasons why Paris' northern suburbs have such a high death rate
Not all deaths are coronavirus related of course and in many places deaths have actually fallen due to factors such as a lack of road accidents or workplace accidents as people were largely confined to their homes.
The deaths are largely confined to the eastern France and the greater Paris region.
In percentage terms, the départements with the highest rate of excess deaths are Haut-Rhin in eastern France (135 percent more than 2019) and five départements in the Paris region; Seine-Saint-Denis (+ 130 percent), Hauts-de-Seine (+ 122 percent), Val-de-Marne (+ 104 percent), Essonne and Val-d’Oise (+ 99 percent each).
As France begins lifting its lockdown the country has been divided into red zones and green zones, with slightly looser restrictions in the green zones, which have low rates of coronavirus infection and hospital occupancy.
READ ALSO What does it mean if you live in a red département?
The red zones. Map: Santé Publique France
Four regions are in red - Île-de-France, Grand-Est, Hauts-de-France and Bourgogne-Franche-Comté - and one département, the overseas territory of Mayotte.
In total between March 1st and April 20th, France recorded 23,225 more deaths than the same period in 2019.
The country's official coronavirus death toll to May 12th is 26,991.
The French official figures include deaths in hospitals and in care homes while countries such as Italy and Spain only count hospital deaths. The UK, while initially counting only hospital deaths, now includes care home deaths in its statistics.
READ ALSO OPINION How can we compare France's coronavirus death toll when countries play by different rules?
The French figures do not include deaths at home, although public health bodies say these will be added from June, but the similarity between the excess deaths and the official figures suggest that the French official death toll is reasonably complete.
Join the conversation in our comments section below. Share your own views and experience and if you have a question or suggestion for our journalists then email us at [email protected].
Please keep comments civil, constructive and on topic – and make sure to read our terms of use before getting involved.
Please log in here to leave a comment.